I gave the error states more care than the charts, and one of them still never appeared.
The error state I built with the most care is the one a user could not reach. I had built it blind and not known it. Finding out why is the part of this dashboard worth writing down.
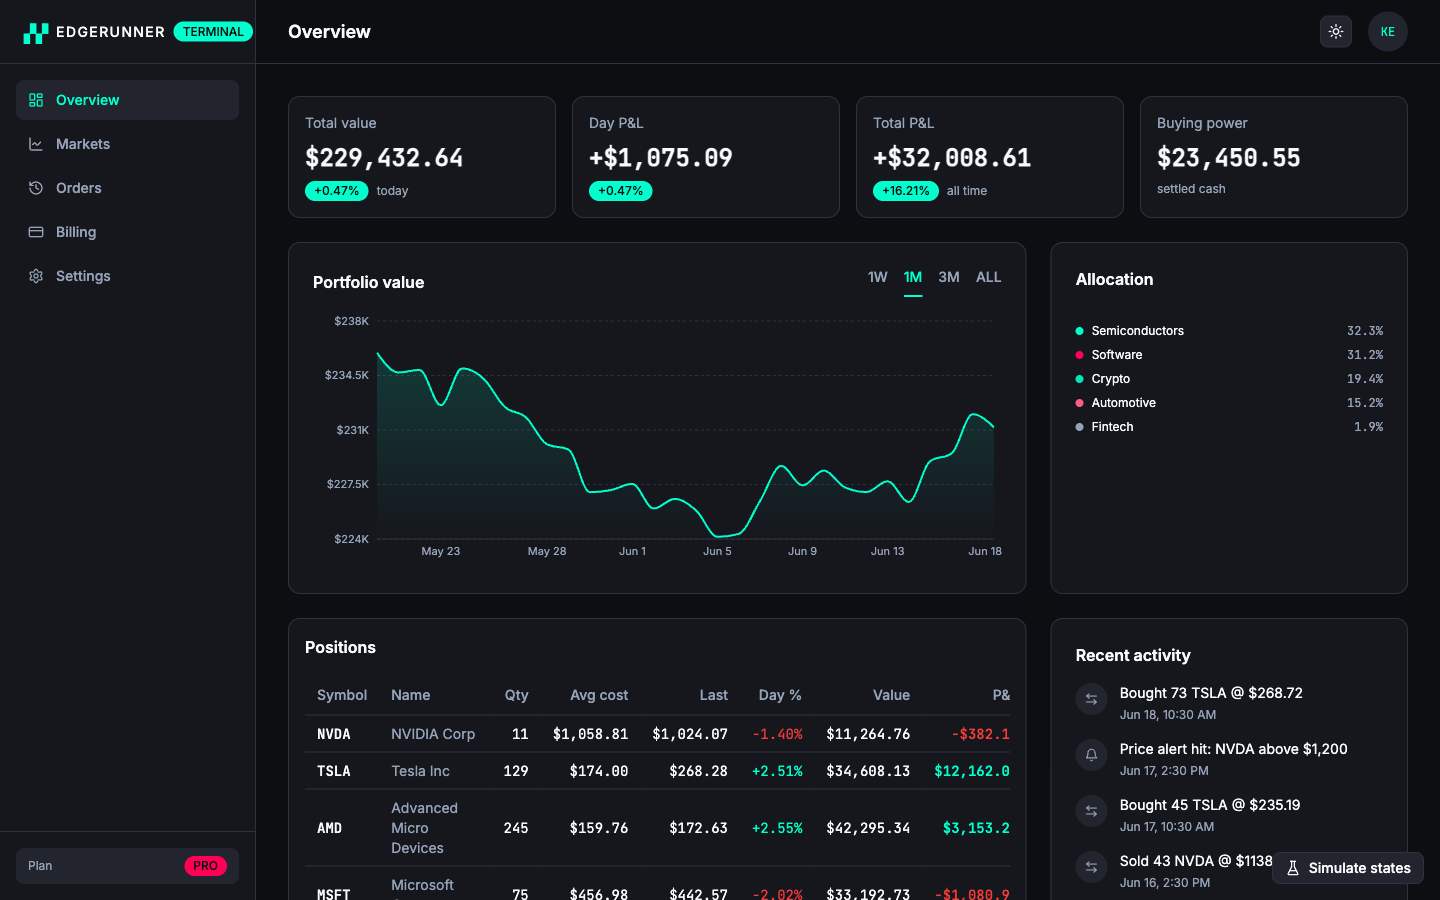
Edgerunner Terminal is the dashboard I watch my own stock portfolio on: positions, profit and loss, a watchlist, orders. Templates like it are sold on a single screenshot, everything populated and calm. That screenshot is the easy part. It is also the part that lies. A dashboard spends a good share of its life with no data, slow data, or broken data, and a template that only shows the happy path has documented the one state it is rarely in.
Every section is a small state machine
Each async block on each screen renders through one component. It is called QuerySection, and it has four outcomes: a loading skeleton, an error with a retry, an empty state with a next step, or the content. Nothing reaches the screen without passing that gate. The positions table, the chart, the invoice list, the API keys, all four states, every one.
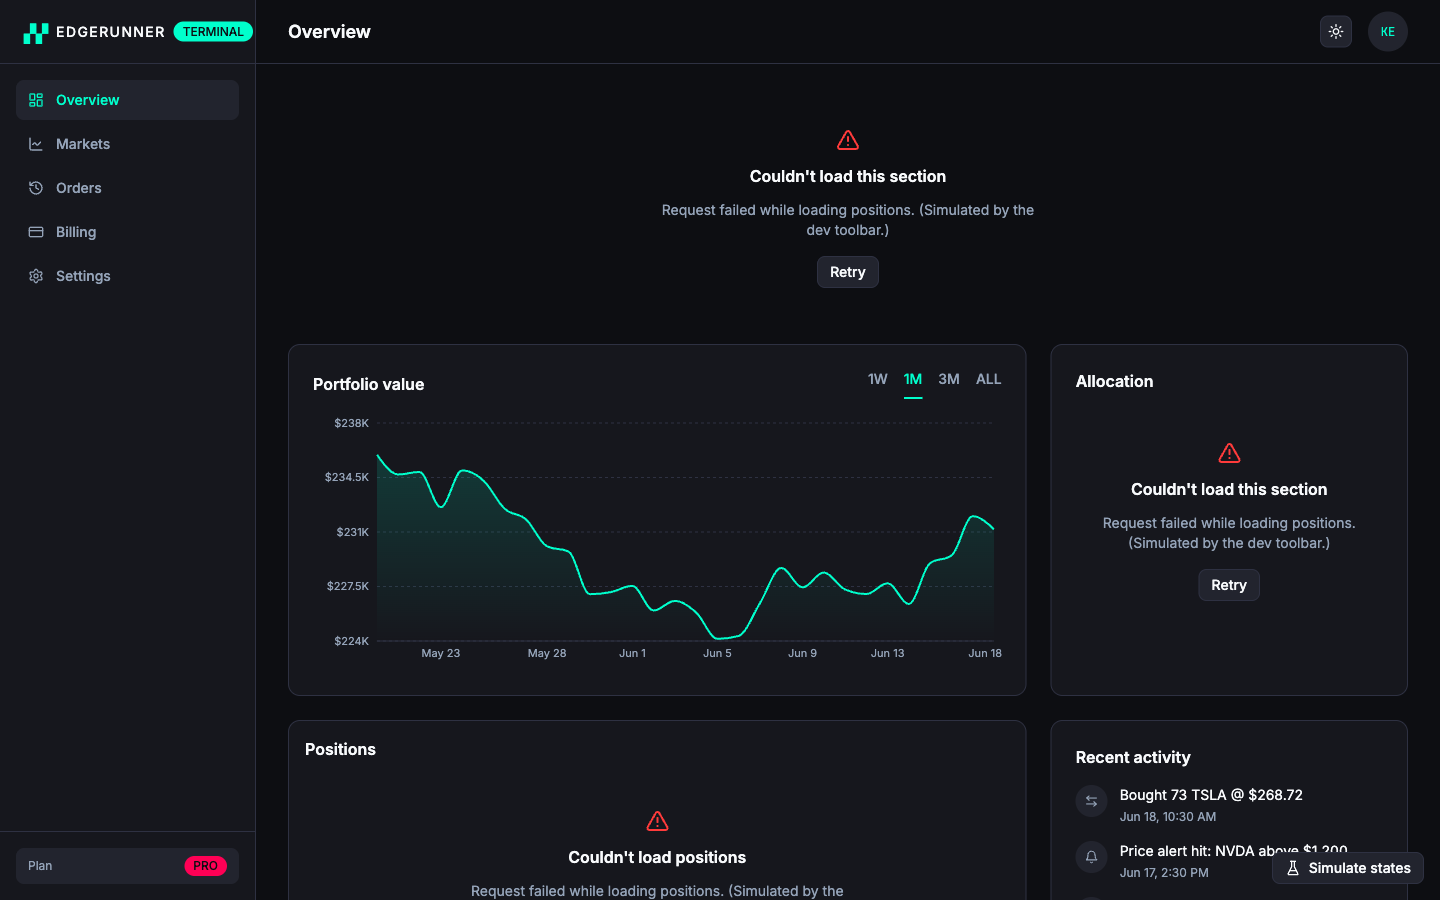
To make the states easy to inspect, a dev toolbar can force any data domain into any state, and the states are addressable by URL. Open the dashboard at ?state=error&domain=positions and one card should fail while the rest loads on.
Fig 1 — ?state=error&domain=positions. One domain fails while everything else loads on, and each failure carries its own retry.
The state I could not see
That is where it broke. I opened the error URL to capture the failure, and the card sat on its loading skeleton and never failed. The data layer was throwing the error correctly. The screen just kept waiting. I stared at it longer than I want to admit.
The cause was quiet, which is the worst kind. The query client pauses retries when the tab is not focused, and the headless browser I was driving reported itself unfocused, so the request that was meant to fail just parked. Sit with that. The state I had given the most care to, the one I was quietly proud of, was the one state the user would never reach. I drew it, styled it, wired its retry, and hid it from the only person it was ever for. Fuck. An error state you cannot see is not an error state. It is a blank space wearing my good intentions.
The fix was two lines: keep the network active regardless of focus, and tell the client it is always focused. Two lines, after all that. Then the failure arrived on screen the way I had drawn it. You do not own a state until you have watched it fail.
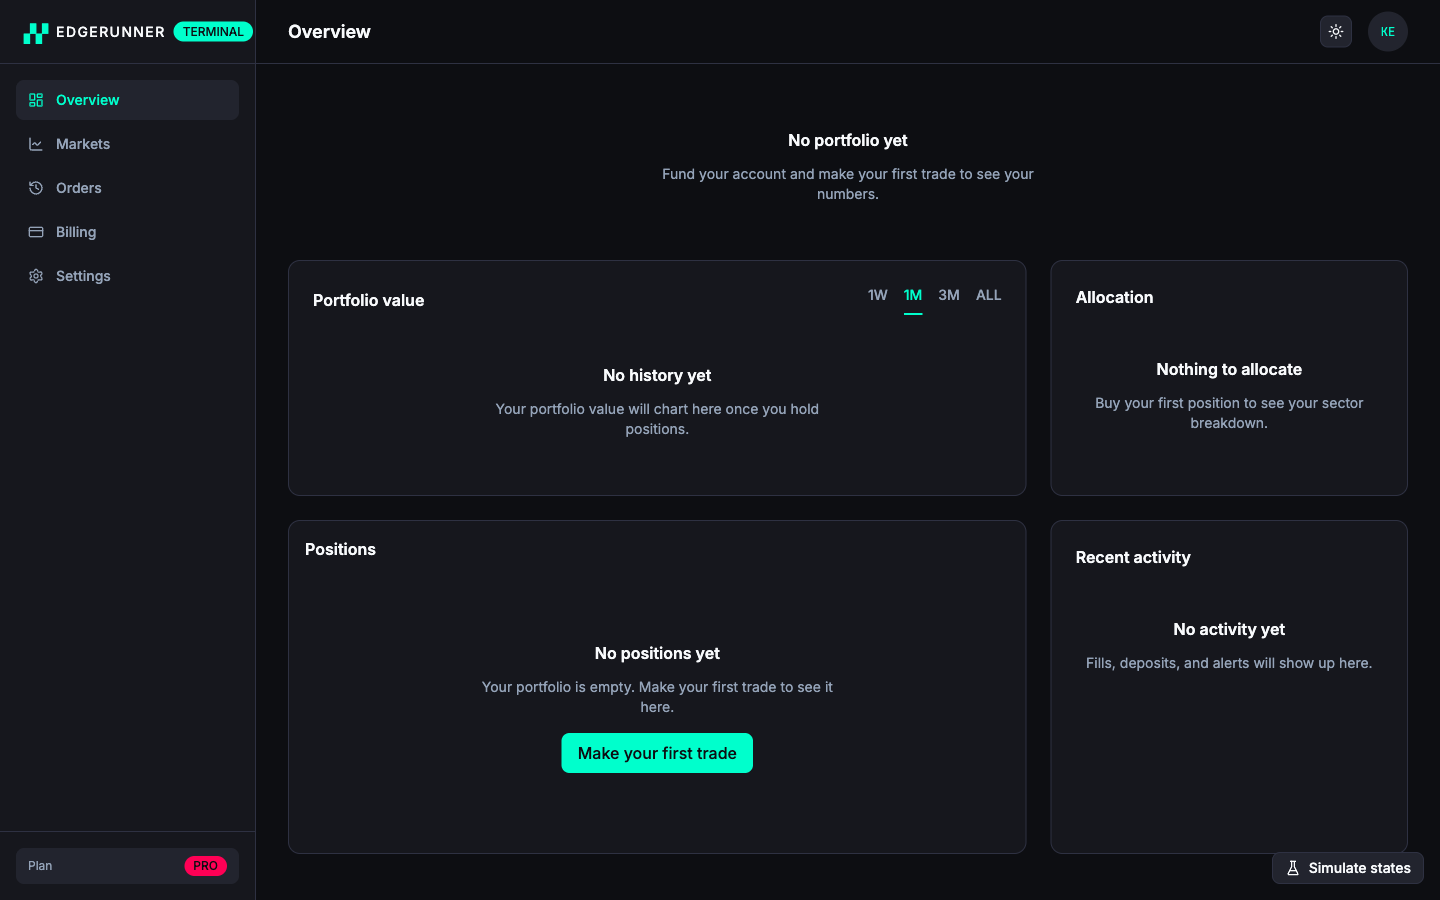
A blank region is a bug that looks like a design. An empty state is a decision.
Fig 2 — ?state=empty&domain=all: the first-run experience. No region is left blank; each one explains itself and offers the next step.
The constraint does the policing
The dashboard sits on a design system kit, and the kit refuses things. No raw hex: every color is a token. No off-grid spacing: the scale is a strict 4px grid, and p-5 does not compile. The neon cyan that reads as a terminal in the dark is var(--color-primary), and it is never typed as #00ffcc anywhere in the app. I reach for a token, and the token is correct by construction. The kit does not trust me to remember. Good. Neither do I.
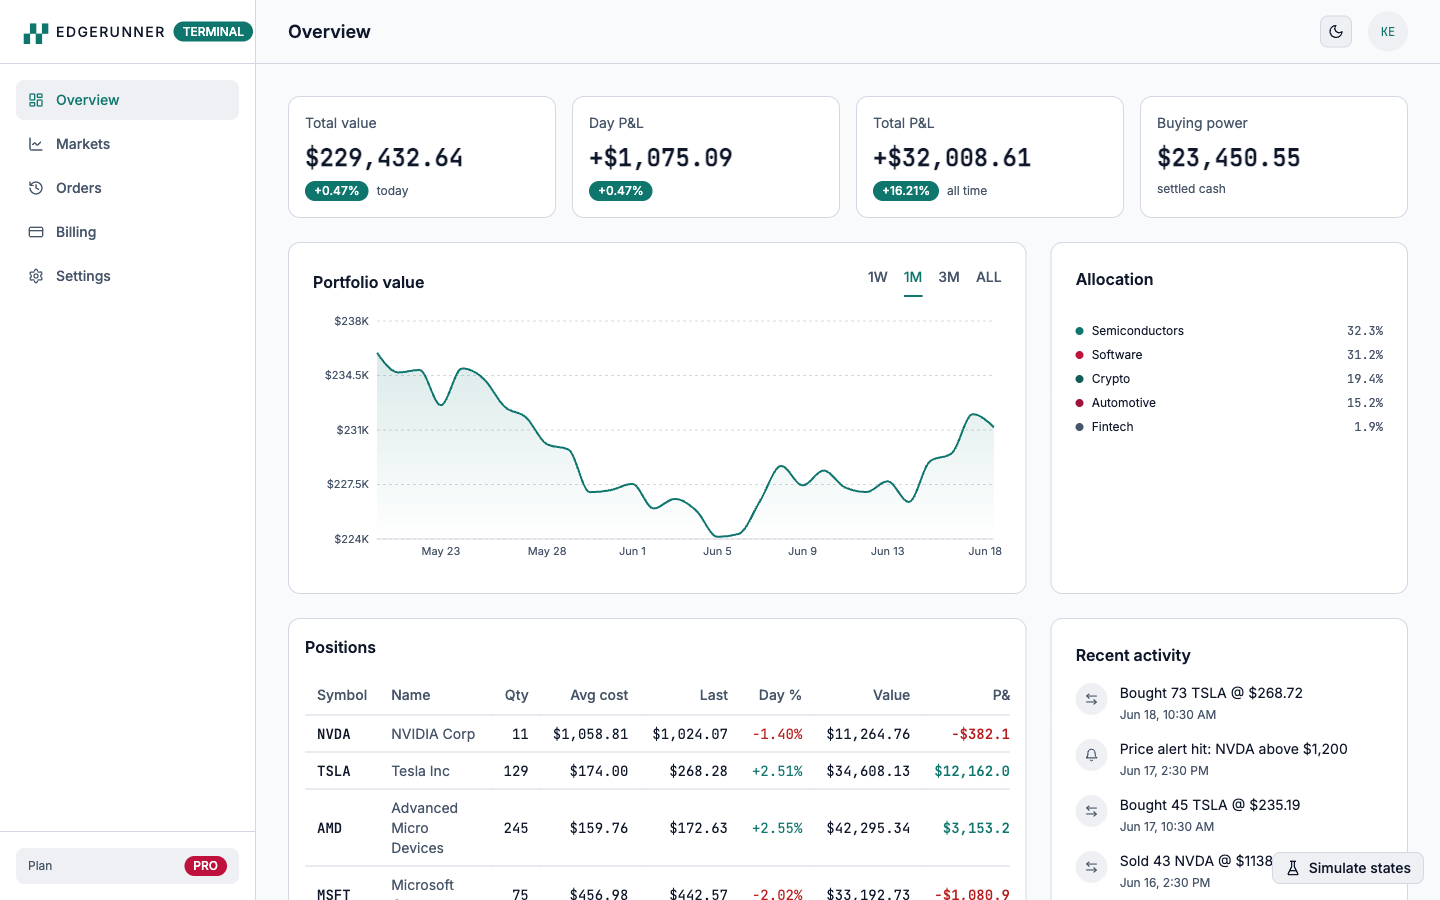
I wanted to watch the portfolio in daylight too, so the light theme lives at the source: one palette in the design file, a data-theme override, every text pairing audited for contrast in both themes at build time. The toggle swaps one attribute, and the charts follow.
Fig 3 — The same screen, light theme. One data-theme attribute flips; tokens, charts, and contrast all follow.
Build it against something real
The dashboard needed parts the kit did not have: a table, tabs, a dialog, a tooltip, a skeleton, an empty state, a card. I did not keep them in the app. I sent them back to the kit, each one with the same contract and accessibility tests as the rest, then used them here. The dashboard was the thing that stress-tested the system, and the system came back seven components stronger. The same parts now live in Figma as two-mode variables and components, so a designer flipping a frame from dark to light does what the code does.
You can run all of this. There is a live demo, the dashboard clones and starts from a single command, and the design system it is built on is open too.
The chart is what you show people. The states are what you live with. Build for the morning the data does not come.